
Just before the UK general election last week, using the probabilities of victory for each party in each seat calculated by electionforecast.co.uk, I posted a set of PDFs for keeping track of the separate battles that would define the contest. The focus was on whether the various left-leaning parties (Labour, SNP, Plaid Cymru, Green, SDLP, plus a couple of independents) across the UK could build a so-called “Anti-Tory Majority”, gaining the 323 seats necessary* to vote down a Conservative Queen’s Speech and thus prevent David Cameron from continuing as Prime Minister, in a widely predicted hung parliament scenario.
Using the probabilities from Election Forecast, I identified the 131 most likely seats that the left-bloc could win in Great Britain (actually 132, since the 131st and 132nd seats on the list were judged to be equally likely wins), which, when added to 188 “safe” Labour seats in England and 4 likely seats for allies in Northern Ireland, would add up to the magic 323. The 131 target seats were highlighted on the PDFs (see below).
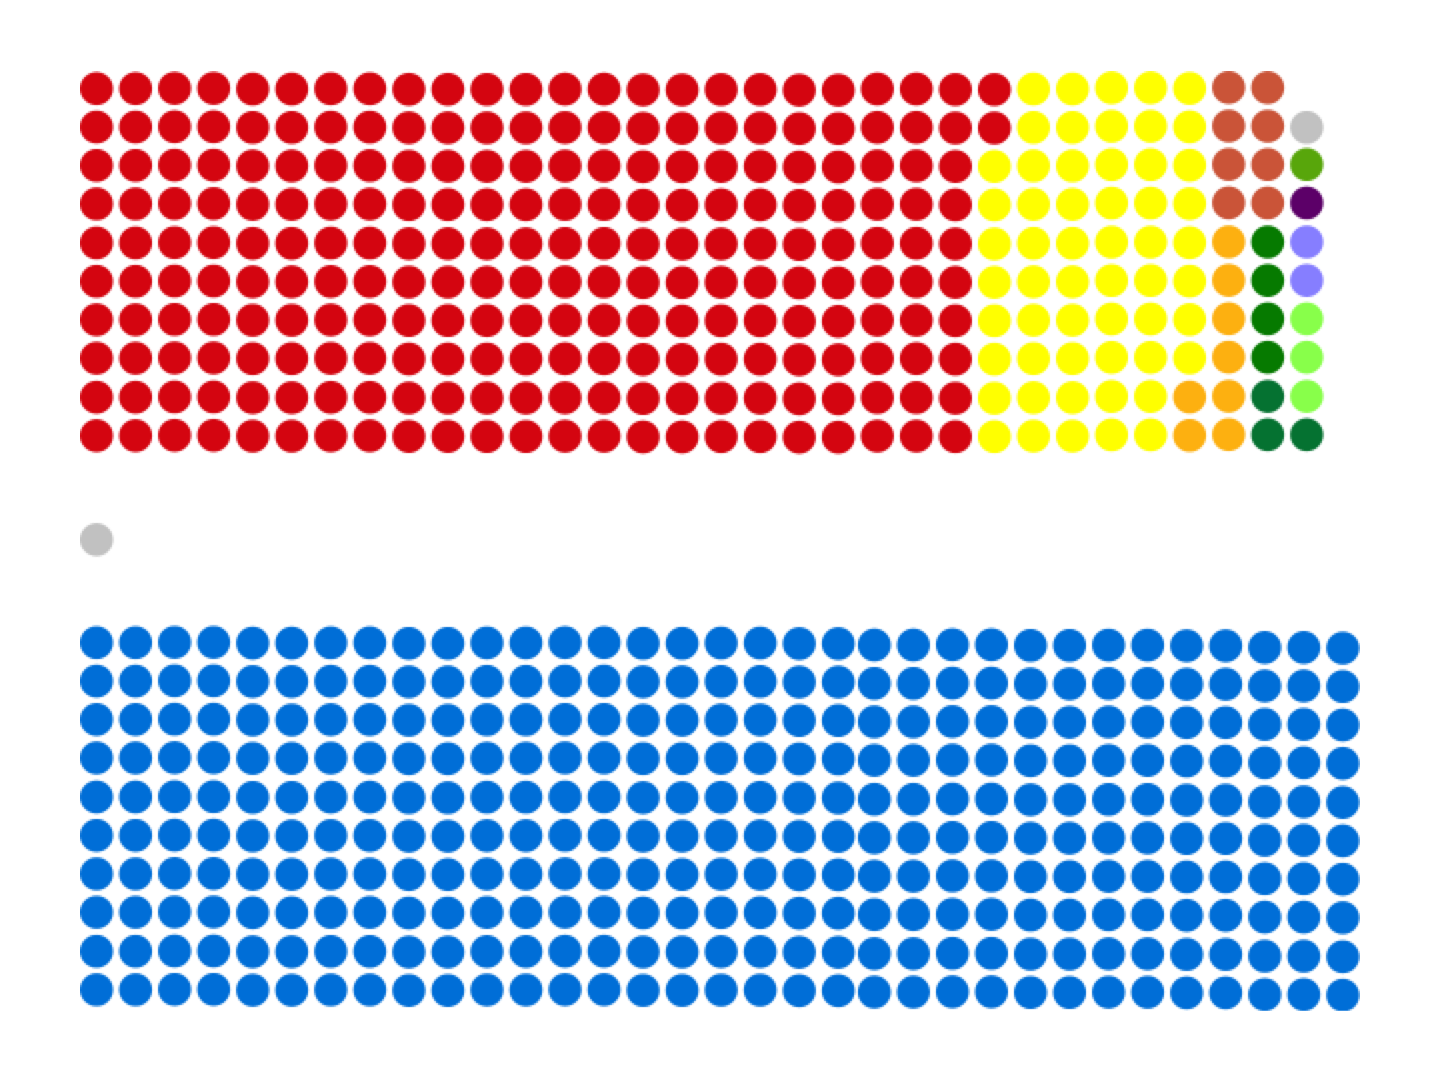
Things looked fairly good for the “Anti-Tory Alliance”, since they were favoured by Election Forecast in 137 of the seats that I listed, six more than they needed. However, on election night, the Conservatives far outperformed expectations, winning 331 seats: a parliamentary majority without needing the support of any other parties.
Where did things go wrong for them?
Scotland
Number of seats: 59
Required by left-bloc: 57
Left-bloc favoured: 57
Won by left-bloc: 57
In Scotland, the left-leaning parties won the 57 seats they needed to stay on track for the “Anti-Tory Majority”, with the SNP sweeping everyone else aside, as predicted. The failure to win Dumfriesshire, a target seat for the left-bloc, was balanced by an SNP win in Berwickshire, where the Conservatives had been favoured by Election Forecast.
Wales
Number of seats: 40
Required by left-bloc: 31
Left-bloc favoured: 31
Won by left-bloc: 28
Most of the Welsh seats that the left-leaning parties needed to win were judged to be certainties or near certainties by Election Forecast. However, Labour’s failure to take Cardiff North from the Conservatives (judged 85% likely to go to Labour) and the shock Labour losses of the Vale of Clwyd (100%) and Gower (99%) left the “Anti-Tory Alliance” 3 seats off their target.
England: Liberal Democrat-held Labour targets (+ Others)
GE2015 – English LAB-LIB Battlegrounds PLUS OTHER – RESULTS
Number of seats: 16
Required by left-bloc: 11 (7 LAB-LIB contests + 4 other seats of interest)
Left-bloc favoured: 12
Won by left-bloc: 13
In the English Lib-Lab battlegrounds, Labour mopped up, winning 10 of the seats on this sheet (they needed 7) and 1 other, Cambridge, that I had not included because Election Forecast gave the Lib Dems a 100% chance of holding on there. However, in the additional seats that I included at the bottom of the PDF, there was the biggest shock of the night as Labour lost Ed Balls’ Morley & Outwood seat to the Conservatives. Nevertheless, the left-bloc outperformed requirements on this sheet by 2 seats.
England: Conservative-held Labour targets
GE2015 – English LAB-CON Top 30 Targets – RESULTS
GE2015 – English LAB-CON Targets 31-60 – RESULTS
GE2015 – English LAB-CON Targets 61-90 – RESULTS
Number of seats: 90
Required by left-bloc: 32
Left-bloc favoured: 37
Won by left-bloc: 10
As has been widely reported, it was in the English Conservative-Labour battlegrounds that the damage to the “Anti-Tory” prospects were done, with Labour winning only 10 of the 32 seats required across these 90 constituencies (though they did win Ealing Central & Acton, which was judged to be one of two tipping point seats – the joint 323rd hardest seats for the left-parties to win – on the basis of the Election Forecast probabilities). Moreover, the Conservatives took 6 of the 188 English “safe” Labour seats that I had not included (all but one of those 188 constituencies had been given a 98% chance or better of staying Labour by Election Forecast).
England: Liberal Democrat-Conservative & UKIP-Conservative Battlegrounds (+ one other)
GE2015 – English CON LIB UKP Battlegrounds – RESULTS
Number of seats: 33
Conservatives favoured: 18
Won by Conservatives: 29
These seats were irrelevant for the “Anti-Tory” question, but with Labour’s poor performance elsewhere, they became very important in determining whether the Conservatives could win a majority on their own. Without the 11 seats that the Conservatives took from the Lib Dems here (and other wins, such as Colchester, which I did not include because Election Forecast reported a 100% chance of a Lib Dem hold), in seats where the latter were favoured, they would have been short of a majority and needing a second coalition (or similar) with either the (considerably stronger) Liberal Democrats or the DUP.
Oh, and Michael Green won too.
Why were the forecasts so wrong?
The fact that, in many areas, things went so differently from what the Election Forecast probabilities implied (particularly in the Liberal Democrat seats and in the Conservative-Labour battlegrounds), is down to problems with their model and, more seriously, to failures of the polling results to accurately discern people’s voting intentions. To represent the true battlegrounds of the election, the sheets that I produced should have covered a slightly different range of constituencies, including more of the “safe” Labour seats and all of those held by the Liberal Democrats.
One of those responsible for the Election Forecast model has discussed what they did wrong here. However, the bigger problem (of which Election Forecast were the victims, to a large extent) was the poor performance of the pre-election polling, which all seemed to suggest a very close race between Labour and the Conservatives, rather than the Conservative majority that actually materialised.
On this subject, I recently came across this fantastic piece of statistical investigation, published a few days before the election, which uses three separate models to show that we all should have been expecting a Conservative win of between 6.8% and 10.9%, with a fair degree of certainty (for a variety of reasons, including systematic and predictable polling bias). Excluding Scotland (where events were clearly lacking historical precedent), the margin of the Conservative victory over Labour in England and Wales was 8.3%. The argument is so stunningly straightforward and convincing that I find it baffling that the political science establishment did not seem to be aware of it, with very few voices of caution being raised about the (completely false) narrative of a likely hung parliament. Well worth a read.
IMAGE: Superbenjamin – Creative Commons
* Parliament has 650 seats. However, Sinn Fein do not take their seats (and the speaker of the house is non-partisan, which could be relevant in extremely close contests), so the number of seats required for a majority is less than the expected 326. Sinn Fein were expected to win 5 seats, which would have meant that 323 seats constituted a majority. However, in the event, they only won 4, so the magic number turned out to be 324. In any case, the Conservative party won 331 seats, so these distinctions were rendered irrelevant.