
For even more Pointless maths, read Part 2, here.
This article is based on a gloriously irrelevant mathematical sequence that is derived (rather appropriately) from the episodes of the television show Pointless. It is the sort of idea that has me scribbling calculations on the back of envelopes for hours on end, despite there being absolutely no hope of an outcome that could in any way justify this investment of effort.
In this first part (Yes, there may even be more to come…), I introduce the sequence and explain how it is related to some well-known mathematical objects called Markov chains. In the vain hope that I might convey my enthusiasm for this topic to others, I have tried to write this piece in a fairly accessible way. Almost no mathematical knowledge is assumed, beyond a rough idea of what probability is.
A pointless logo…
For those who haven’t seen it, Pointless is a BBC television quiz series, hosted by Alexander Armstrong and Richard Osman. In each epsiode, four teams of two compete over four rounds, with one team eliminated at each stage. In the final round, the last pair standing has the opportunity to compete for the Pointless jackpot, which rolls over from show to show from a starting value of £1000.
The questions follow a sort of reverse Family Fortunes model. Each one is asked to a hundred people before the show, with correct answers from contestants being awarded points based on how many members of this survey group offered the same answer. However, since it is the highest scoring team in each round that is eliminated, the aim is to come up with an answer that is as obscure as possible, with ‘‘pointless’’ answers being the most highly sought after.
The key point for the purposes of this article, is that each team gets two chances to reach the final round. A team that is eliminated on their first appearance without getting to play for the jackpot is invited back in the following episode for another shot at glory. However, the team that makes it through to the final round is not invited back, no matter whether they actually win the jackpot or whether it was their first or second appearance.
From a mathematical point of view, this format is quite interesting since it means that the number of new teams in each episode forms a sequence which exhibits some intriguing patterns, and it is these patterns that I want to explore. In particular, I am interested in how frequently we should expect each line-up to occur in the long term. In fact, this is not an entirely trivial question; if you were involved in the production of the show, you might well want to know how many new teams to expect from episode to episode, since this would inform how easy it would be to find enough contestants, how large your catering budget should be, and so on.
If we let N represent a new team and R represent a returning team, then there are four possible line-ups for each episode. We can label these with the numbers 1-4, corresponding to the number of new teams in each line-up:
- NRRR
- NNRR
- NNNR
- NNNN

Some pointless pencils…
Note that it is impossible to have a show with four returning teams because every episode has a winning team, who never return for the following episode. Also, we are not interested in the order of the teams, only of the number of new and returning teams there happen to be in a given show.
Using this ‘code’, we can turn a run of episodes into a sequence of numbers, based on the number of new teams appearing in each show. For example, the sequence might begin:
4, 1, 4, 1, 3, 2, 2, 2, 3…
Since first-time losing teams from the final episode of a particular series are invited back for the first episode of the next series, the twelve series of the show broadcast to date can be used to generate an unbroken sequence of over 600 numbers. Or at least, this is how we would like things to be. Unfortunately, at this point we we have to face up to one of the fundamental laws of statistics: Real data is messy. Numbers drawn from the real world, even from something as apparently orderly as a TV quiz show, are very rarely neat and tidy, and there are indeed a few irritating complications that we will have to deal with before going any further.
Firstly, Series 1 had five teams in each episode rather than four, so, to keep things simple, we will have to start our sequence from the first episode of Series 2. Secondly, the odd special episode has been thrown into the mix from time to time, featuring celebrities or returning losers or whatever, and these episodes do not contribute to our sequence, meaning that it is not easy to know exactly how many standard episodes have been broadcast, which means that we are unsure of the true length of our sequence. Also, there may well have been occasions when would-be returning teams have been unable to film their second episodes for some reason, which piles further uncertainty on to proceedings.
Having done my duty by mentioning these difficulties, I am now going to exercise my scientific right to largely ignore them and plough on regardless. This method is an ancient and much cherished mathematical principle. If you come across an obstacle that is too difficult or too boring to deal with, the best approach is often to pretend that it doesn’t exist and see whether you get the right answer anyway.
Getting back to our sequence then, the first thing to notice is that it is not completely random. There are some clear rules that can be set down about how the numbers must follow on from one another. For example, 4 must always be followed by 1, since in a show with four new teams, the winning team is the only one that will not be invited back and there will therefore be only one new team in the following show. Using similar logic, we can determine how the sequence continues after each possible number:
- 1 is followed by 3 or 4;
- 2 is followed by 2 or 3;
- 3 is followed by 1 or 2;
- 4 is followed by 1.
We can represent these statements using a directed graph (a sort of flow diagram) showing how the sequence can be built up:
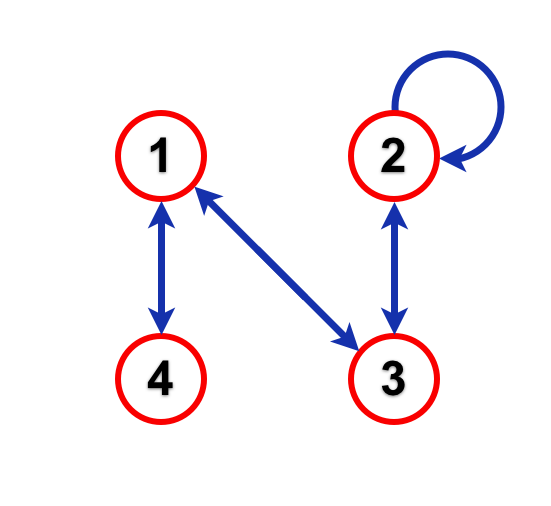
A directed graph of Pointless line-ups
The four circles, representing the four possible line-ups of an episode, are called states while the arrows connecting them are called transitions.
By following the arrows on the graph, we can produce a sequence of numbers to represent a possible series of episodes of Pointless. For example, if the sequence started with a 4, we would then have to move to 1, since the only arrow leading out of state 4 leads to state 1. From there, we could follow the arrow back to 4 or the one that leads to 3, and so on and so on, building up a sequence of numbers as we go.
The true run of Pointless episodes must have produced a sequence like this, following the arrows of the graph. Unfortunately, I don’t know exactly what this sequence is, and watching all of the 600 plus episodes to find out is not really feasible. However, as we will see, there are some nice mathematical tools that we can use to tell us a little more about what the sequence should look like.

A pointless railway…
Let’s assume (for the time being, at least) that each team in a particular show has an equal chance of winning. On the face of it, this does not seem a particularly unreasonable assumption, since we know nothing about the teams and, in any case, the quiz itself involves a significant amount of luck, both through the topics of the questions that are asked and through the order in which teams are required to provide answers (randomised for the first round and then based on past performance).
Using this assumption, for each of the four possible episode line-ups, we can calculate the probability that either a new team or a returning team will be victorious, and hence the probability associated with each of the possible transitions for that line-up. For example, if a particular episode has line-up 3 (NNNR), the probability that a new team will win the episode is 0.75 (or 3/4), while the probability that a returning team will win the episode is 0.25 (or 1/4). In the first case, the next episode will have two new teams, corresponding to the transition from state 3 to state 2, while in the second case, the next episode will have one new team, corresponding to the transition from state 3 to state 1.
Using this method, we can calculate the probabilities of every transition. It is convenient to collect these probabilities together in a square arrangement called a transition matrix, like this:
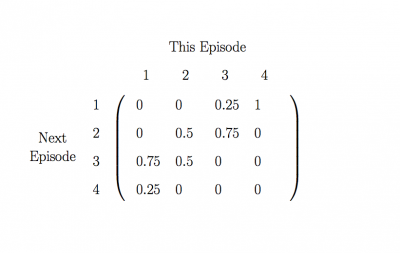
The transition matrix of Pointless line-ups
The matrix tells us the probability of going from any line-up in one episode to any other line-up in the next episode. For example, to find the probabilty that an episode with two new teams will be followed by an episode with three new teams, we look at the entry in column 2 and row 3. This entry is 0.5, so we know that there is a 50% chance that this will happen. In terms of our numerical sequence this means that we would expect about half of all the 2s in the sequence to be followed by a 3.
Systems like this, with a number of different states, where we can write down the probabilities of moving from one state to another, are called Markov chains, and quite a lot is known about them and the sort of sequences that they produce.
The transition matrix of a Markov chain is extremely useful, since it can be used to tell us the probability that we will find ourselves in any particular state at any future time, provided that we know which state we started in. For example, if we know that our chain of Pointless episodes started with four new teams, we can use the transition matrix to calculate the probability that the 100th episode had only one new team. The calculation that we would have to do can be written as:
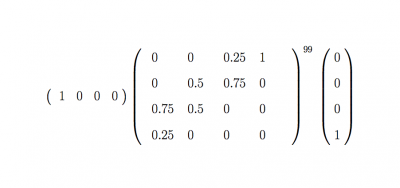
Considering the 100th episode
We don’t need to understand exactly what this means, but we can gain a rough understanding by looking at each part separately. For example, the transition matrix is raised to the power of 99, because there will be 99 transitions between the first episode and the 100th episode. To the right of the matrix, we see a column vector with a 1 in the fourth position and 0s everywhere else, which represents the fact that we start in state 4. Then looking to the left, we see a row vector with a 1 in the first position and zeros everywhere else, which has the effect of picking out the probability of being in state 1.
Anyway, if we do the maths, the calculation all boils down to a single number: approximately 0.114 . We therefore conclude that there is roughly an 11.4% chance that the 100th episode had only one new team.
What is really interesting though, is that if we repeat the same calculation for the 101st episode or the 250th or the 317th, we get pretty much exactly the same answer. Each of these episodes and every episode from around the 30th onwards, has approximately an 11.4% chance of introducing precisely one new team.

A pointless poster…
Very helpfully, it also would not have mattered if we had started the sequence in a different state. If we had started from 1, 2 or 3, the calculation described above would still give a probability of around 11.4% that any particular episode, after the first thirty or so, would involve precisely 1 new team. This is particularly handy, since it means that we do not really need to know how many new teams there were in the first episode of our sequence, because, after a certain point, the sequence ‘forgets’ where it started and the probabilities end up the same for all starting points.
In fact, this phenomenon is a general trick of Markov chains. It turns out that any Markov chain that obeys a few simple conditions has what is called a limiting distribution. This means that, provided that the chain has been running for long enough, the probability that you will find yourself in any particular state gets closer and closer to some fixed value. Since our chain fulfils the necessary conditions, it has a limiting distribution.
In terms of our sequence of Pointless episodes, this means that after a certain number of episodes have been recorded, the probability that any subsequent episode involves a particular number of new teams never changes, assuming that you do not have any extra information about the line-ups of the episodes that came before it.
The limiting distribution can be calculated by solving a matrix equation:
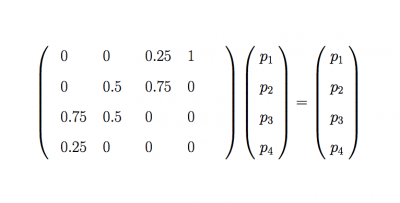
Finding the limiting probabilities
Here, p1, p2, p3 and p4 are our limiting probablities for each of the four states. Again, we won’t go into details about how this equation works, but we see that when these probabilities are combined with the transition matrix (on the left of the equals sign), they remain the same (right of the equals sign). This means that the limiting probabilities are somehow unaffected by the transitions of the chain.
Solving this equation to find p1, p2, p3 and p4 gives us the probabilities that any episode of Pointless, after the first thirty, will involve one, two, three or four new teams:
- Probability of 1 new team: 11.4%
- Probability of 2 new teams: 51.4%
- Probability of 3 new teams: 34.3%
- Probability of 4 new teams: 2.9%
These percentages should also tell us how often each of the four line-ups appears over a long sequence of episodes. Ignoring Series 1 (as we mentioned earlier) and Series 12, which is still being broadcast, the ten seasons in between have a total of 30 + 50 + 60 + 60 + 70 + 70 + 65 + 55 + 70 + 55 = 585 episodes*. As discussed earlier though, these include some episodes with specially invited teams, which can’t be included in our sequence. We don’t know how many of these episodes there are, but if we guess that there is about one per series, that leaves us with 575 episodes to work with.
A pointless pi…
We can therefore use our percentages to estimate the number of episodes across Series 2-11 with each of the four line-ups of new and returning teams, giving approximately:
- 66 episodes featuring 1 new team;
- 296 episodes featuring 2 new teams;
- 197 episodes featuring 3 new teams;
- 17 episodes featuring 4 new teams.
Annoyingly, these numbers don’t actually sum to 575, but this is not unexpected, since we have lost accuracy by rounding to whole numbers. Adding up all the predicted new teams gives us an estimate of 1315 for the total number of teams introduced across the ten series (not counting any teams carried over from the last episode of Series 1), at an average of about 2.29 new teams per episode.**
It would be interesting to know how near these estimates are to reality. Assuming that we have got the number of regular episodes about right and that there aren’t too many breaks in the chain, I would guess that they should not be too far off. 575 certainly feels like it should be a big enough number to smudge out the effects of random variations, though I have not checked whether this is actually the case.
However, if the estimates are wrong, the most likely culprit would be our assumption that all teams have an equal chance of winning. Is this really reasonable? Surely some people just know more stuff and therefore have a better chance of doing well? And what about the fact that only losers are invited back? You will no doubt be relieved to know that these vitally important questions will be addressed in Part 2, in which we will give this topic even more undeserved attention, moving on from Markov chains into the world of agent-based modelling.
For even more Pointless maths, read Part 2, here.
This article was included in the 117th Carnival of Mathematics hosted by Plus Magazine. Visit those sites for other pieces on mathematical topics.
* According to the BBC, which you would hope would be the most reliable source, although other sites seem to disagree on these figures.
** Actually, (66 × 1) + (296 × 2) + (197 × 3) + (17 × 4) = 1317, rather than 1315, but this difference is again down to rounding error.
IMAGES:
Pencils: Becks – Flickr Wikimedia Commons
Railway: Simon Wa – Wikimedia Commons
Kitchener Poster: Public Domain
Pointless Logo: Taken from the Wikipedia article on Pointless and used in the same spirit as there.
Others: Original
Thomas Oléron Evans, 2014
Despite all my horribly biased anti-intellectual assumptions based on the title, I find myself looking forward to the next part!
I thought about this a bit, see the puzzle at the end of http://aperiodical.com/2013/07/how-to-win-at-pointless/ – I wondered whether, if you could rig the show either to guarantee a new or returning pair wins, can you ensure there are no new teams on a show a specified time in the future?
This may seem a pointless(!) piece of maths, but…. The show’s producers will need to know as soon as possible how many contestants they can expect to need for a run of shows. I would have expected them to have conducted some kind of mathematical reasoning as to how many contestants they needed, but I doubt it would be anywhere near as in-depth as what you have here!