
In the first part of this article, we looked at the sequence formed by the number of new teams in consecutive episodes of the TV quiz show, Pointless. Using some nice mathematical tools, we were able to predict the proportion of episodes that we would expect to see with each possible line-up of new and returning teams. In this follow-up article, we voyage into the far future of broadcasting (sort of) and drift through the Pointless multiverse, to investigate whether our previous results may actually have been total rubbish.
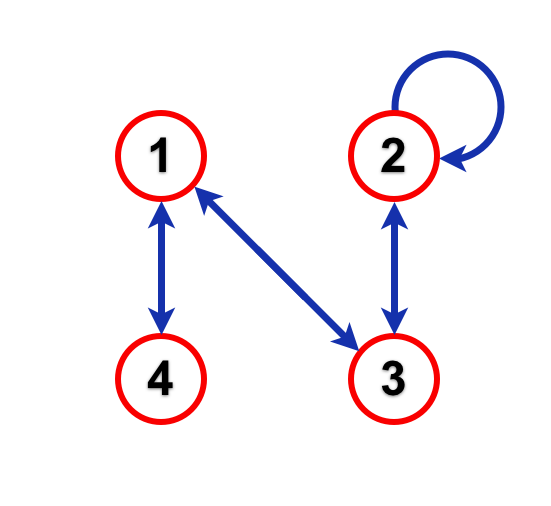
Before we start, let’s recap the key points from last time. First, we gave a number to each of the possible line-ups of new teams (N) and returning teams (R) in an episode of Pointless, based on how many new teams there were in that particular show:
- NRRR
- NNRR
- NNNR
- NNNN
Using this code, were able to transform a run of Pointless episodes into a numerical sequence. We noticed that the numbers in this sequence could only follow on from one another in certain ways, and we represented this knowledge in a flow diagram (or a “directed graph”):
 We then used something called a Markov chain to represent the sequence, and did some calculations to work out the proportion of episodes with each line-up that we would expect to see in the long term. Ultimately, this produced the following results:
- Expected proportion of episodes with 1 new team: 11.4%
- Expected proportion of episodes with 2 new teams: 51.4%
- Expected proportion of episodes with 3 new teams: 34.3%
- Expected proportion of episodes with 4 new teams: 2.9%
At this point, we considered that we had worked hard enough for one day and patted ourselves on the back to congratulate ourselves on a job well done. However, there was a problem with our method.
To get these results, we had made the assumption that each team in an episode of Pointless has an equal chance of winning. This is equivalent to saying that Pointless is a game of pure luck. Now, while this made all the maths nice and simple, unfortunately, it is also pretty clearly not true. Pointless is a quiz, it tests the knowledge of its contestants, and some people just know more stuff than others. While this would not be a problem if we only saw each team once (since we would not have any prior knowledge of which teams were better or worse in any case), the fact that teams can return and, crucially, that whether or not they return is based on their previous performance, basically screws up all our careful analysis.
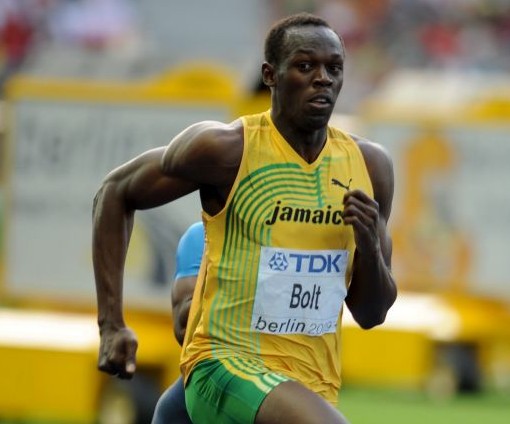
He may be fast, but can he name a pointless Robert Redford film…?
To understand why this is, let’s consider a 100 metre race between four randomly chosen men. If you do not know who these men are, then as far as you are concerned, they each have an equal chance of winning. However, once the race has been run, this is no longer the case. Whether or not you know their exact times, their finishing positions will give you some evidence about how good they are relative to one another.
Suppose the three losers are invited back to run again against a new randomly chosen competitor. Now, for all you know, this new runner could be anyone, from Usain Bolt to a ninety-eight year old ex sumo wrestler. However, while our three returning losers could also be elderly Japanese martial artists, we can be pretty sure that none of them is Usain Bolt, because he would be very unlikely to have been beaten in the first race. In general then, we should expect the average quality of a set of new unknown runners to be higher than the average quality of those that we have already seen lose a race.
The same is true in our episodes of Pointless. While any new team could be the Usain Bolts of general knowledge, by failing to win at their first attempt the returning teams have demonstrated that they are unlikely to be at this level. Just like the sprinters, we would expect the average standard of new teams to be higher than the average standard of returning teams, and this should be reflected in their probabilities of victory.
Sadly, the cold reality of this logic goes against the reassuring suggestion, occasionally made in the show, that the wise old returning teams have some sort of advantage over the inexperienced newbies. While this may well make returnees feel better about having fallen short, the maths suggests that, on average, the opposite is almost certainly the case.*

Thou shalt not covet thy neighbour’s trophy…
What we would like to understand is the effect that all this might have on the proportions of episodes with each line-up that we would expect to see. How and how much should we expect the values that we calculated last time to change if we take the differing knowledge of the teams into account?
To answer this question, we are going to take the opposite tack from last time and, rather than assuming that Pointless is a game of pure luck, we will assume that it is a game of pure skill. If this is the case, then there must be some teams that are stronger than others and we will need some way of measuring their relative strength.
To do this, we will give every team a number, which we will call their Pointless skill. This number is meant to represent how good the team is in relation to others, so we can think of it as some sort of measure of their general knowledge, focussed on the areas that might be covered in a typical Pointless question.
Now, since we have just made it up, we have no way of calculating a team’s Pointless skill, or any idea what the number would really mean if we could. Luckily though, because we are only interested in which team will win a given episode, the precise values do not actually matter. The only thing that does matter, is that we can put them in order. Each episode can then be seen as a sort of four-way game of Top Trumps, where the skills of the teams are compared, with the highest ending up as the winner.
To make things simple, let’s say that the Pointless skill is always a number between 0 and 1, such that all teams can be placed somewhere on the following scale:
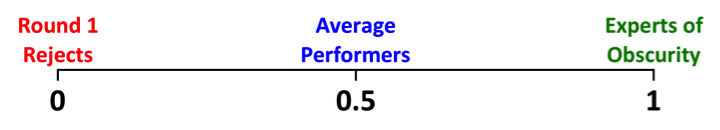
Since it is only the order that matters, we might as well assume that the skill levels of different teams are evenly distributed across this scale. In other words, for each new team, we can suppose that their skill level is just a uniformly selected random number between 0 and 1, of the sort that you can generate on a scientific calculator, or with the RAND function in Excel.
Now, let’s think about the beginning of our sequence and see how the introduction of Pointless skill might change things. To make our lives easier, we will start our sequence from an episode with four new teams, which, as we know from last time, will be followed by an episode with only one new team. Last time out, we were able to calculate the probability that an episode like this second one, with line-up 1 (NRRR), would be won by the new team. Can we do that here?
In this case, the answer is yes. While, in pure luck Pointless, the probability that the new team wins would be 0.25 (or 1/4), in the new pure skill Pointless it is considerably higher at 0.4 (or 2/5). To see why this is, we just need to consider all five of the new teams introduced across the two episodes together, four from the first episode and one from the second. There are five equally likely possible cases, because, of all these five teams, it is equally likely that the team introduced in the second episode will be ranked first, second, third, fourth or fifth in terms of skill. These five cases are shown in the following diagram:
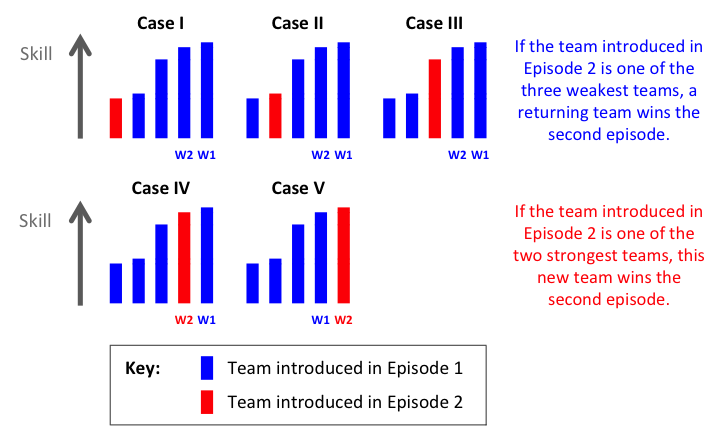
In the diagram, the bars represent possible skill values of the five teams that feature in the first two episodes, with the four teams introduced in Episode 1 coloured blue and the single team introduced in Episode 2 coloured red. For each case, we have indicated the winners of each episode (marked W1 & W2) and we see that, in two of the five cases, the second episode is won by the new team. Therefore, the probability of this outcome is 0.4.
This is a neat result, but unfortunately, this is as far as our analysis is going to go, since things only get more complicated from here. What if the new team in the second episode fails to win and is carried over to the third episode? To find the probability that it will win on its second attempt, we would need to calculate the chance that a team that has failed to beat three teams that had already lost a match will beat three new teams… And if it does win, then for the teams carried forward into the following episode, we would need to know the probability that one of three teams that have failed to beat a team that had failed to beat three teams that had already lost a match would beat a new team…
“We gave 100 people 100 seconds to tell us the probability that one of three teams that have failed to beat a team that had failed to beat three teams that had already lost a match would beat a new team…”
If there is a nice mathematical way of dealing with all this, I either do not know it or cannot spot it. For this reason, instead of attempting to use some kind of mathematical cleverness to find the proportions of episodes with each line-up, as we did last time with the Markov chains, I am instead going to turn to the best friend of the lazy mathematician. A computer.
When you find yourself up against a problem like this, which you cannot solve directly, you can often get a pretty good understanding of what is going on by running a computer simulation and just seeing what happens. In this case, we can quite easily simulate a long sequence of Pointless episodes, randomly generating skill values for each team, and counting up the number of occurrences of each line-up that we observe along the way. If we simulate a long enough run of episodes, we should be pretty confident that the proportions of each line-up that we observe will be very close to the theoretical “perfect” values.
This approach is called Monte Carlo simulation, presumably because, as in a casino, you are trusting to chance to produce the results that you want. Usually, all this randomness means that you have to run a simulation many times to get reliable results. However, in our case, one very long simulation should suffice, since each time we get an episode with four new teams, it is like a new start anyway.

Pointless researchers are asked to come up with original questions for Series 18182…
I chose to run a simulation of one million consecutive episodes of Pointless, which my computer was able to polish off in a matter of minutes. Assuming that the rate of broadcast remains roughly the same as it has been up to now (about 120 episodes per year) and with an average of 55 episodes per series, a run of this length would keep Pointless on air well into its 18182nd series, which we can expect to see on our screens somewhere around the year 10342.**
Here are the line-ups of the first ten episodes produced by the simulation, including the randomly generated Pointless skill (PS) values for each team (to 3 decimal places). To keep things clear, returning teams are placed directly below their original appearance and the winning team of each episode has been underlined.
- 4: N (PS: 0.766), N (PS: 0.120), N (PS: 0.002), N (PS: 0.918)
- 1: R (PS: 0.766), R (PS: 0.120), R (PS: 0.002), N (PS: 0.883)
- 4: N (PS: 0.210), N (PS: 0.319), N (PS: 0.619), N (PS: 0.685)
- 1: R (PS: 0.210), R (PS: 0.319), R (PS: 0.619), N (PS: 0.762)
- 4: N (PS: 0.659), N (PS: 0.458), N (PS: 0.445), N (PS: 0.019)
- 1: N (PS: 0.663), R (PS: 0.458), R (PS: 0.445), R (PS: 0.019)
- 4: N (PS: 0.790), N (PS: 0.718), N (PS: 0.404), N (PS: 0.563)
- 1: N (PS: 0.604), R (PS: 0.718), R (PS: 0.404), R (PS: 0.563)
- 3: R (PS: 0.604), N (PS: 0.405), N (PS: 0.144), N (PS: 0.122)
- 1: N (PS: 0.292), R (PS: 0.405), R (PS: 0.144), R (PS: 0.122)
Even this short run of simulated episodes seems to demonstrate the increased strength of new teams over returning teams, which we had predicted. In the pure luck version of Pointless, we would have expected 75% of episodes with only one new team to be won by a returning team, yet only two of the five such episodes (40%) in this run are won by returning teams. Although drawing conclusions from such a small number of examples is not usually sensible, seeing results that roughly match our predictions should at least reassure us that we may be on the right track.
Here are the complete results for all one million episodes, with the proportion of episodes with each line-up given to one decimal place. The proportions that we calculated last time, for the pure luck version of Pointless, are given in brackets.
- 86182 episodes had 1 new team: 8.6% (pure luck value: 11.4%)
- 485384 episodes had 2 new teams: 48.5% (pure luck value: 51.4%)
- 389540 episodes had 3 new teams: 39.0% (pure luck value: 34.3%)
- 38894 episodes had 4 new teams: 3.9% (pure luck value: 2.9%)
The interesting thing here is that taking the different skill levels of the teams into account seems to have had relatively little effect on the proportions of episodes with each line-up. All the new proportions are within 5 percentage points of their previous values. It seems that, in the pure skill version of Pointless, we should see a few more episodes with 3 or 4 new teams and a few less with 1 or 2 new teams, but the differences are not huge.
Of course, in reality, Pointless is neither a game of pure luck nor a game of pure skill, but lies somewhere in between. A particularly knowledgeable team will be more likely to win, but even the best team could be unlucky with the topics that come up or could fall to a string of lucky guesses from their opponents. While the skill of each team, in terms of their specific knowledge, may be fixed, their performance in a particular episode will involve some degree of randomness.
Richard: Still overcome at the thought of a ‘Pointless Teams’ edition of Top Trumps…
Happily, we can also build this random performance into our simulation, to see what sort of sequence of episodes a part-luck-part-skill version of Pointless (like the real show) would produce. As before, we will suppose that each team has their own Pointless skill, but this time the team will also have a Pointless performance, which will vary between their first and second appearances (if they return). The winning team in each episode will be the one with the greatest performance, rather than the one with the greatest skill.
Like their Pointless skill, a team’s Pointless performance will be a number between 0 and 1. However, we cannot select the performance completely randomly, because we still want a team’s skill to have some relevance. Instead then, we will select a team’s Pointless performance such that it is likely (but not guaranteed) to be close to their Pointless skill. How closely related the skill and performance are will depend on the precise balance between luck and skill that we feed into the simulation. In this way, a team will be likely to put in a performance that is in line with their skill level, but may occasionally perform significantly better or worse.
In our simulation, to generate a team’s Pointless performance for a particular episode, we will use some specially chosen probability distributions. A probability distribution is just a precise rule that tells us which numbers are likely and which are less likely. In this case, we want a distribution in which numbers close to a team’s Pointless skill are the most likely, with higher or lower values becoming increasingly unlikely.
Two examples of possible probability distributions are given below, for a team with a Pointless skill of 0.7. The distributions are represented as graphs over the numbers from 0 to 1.***
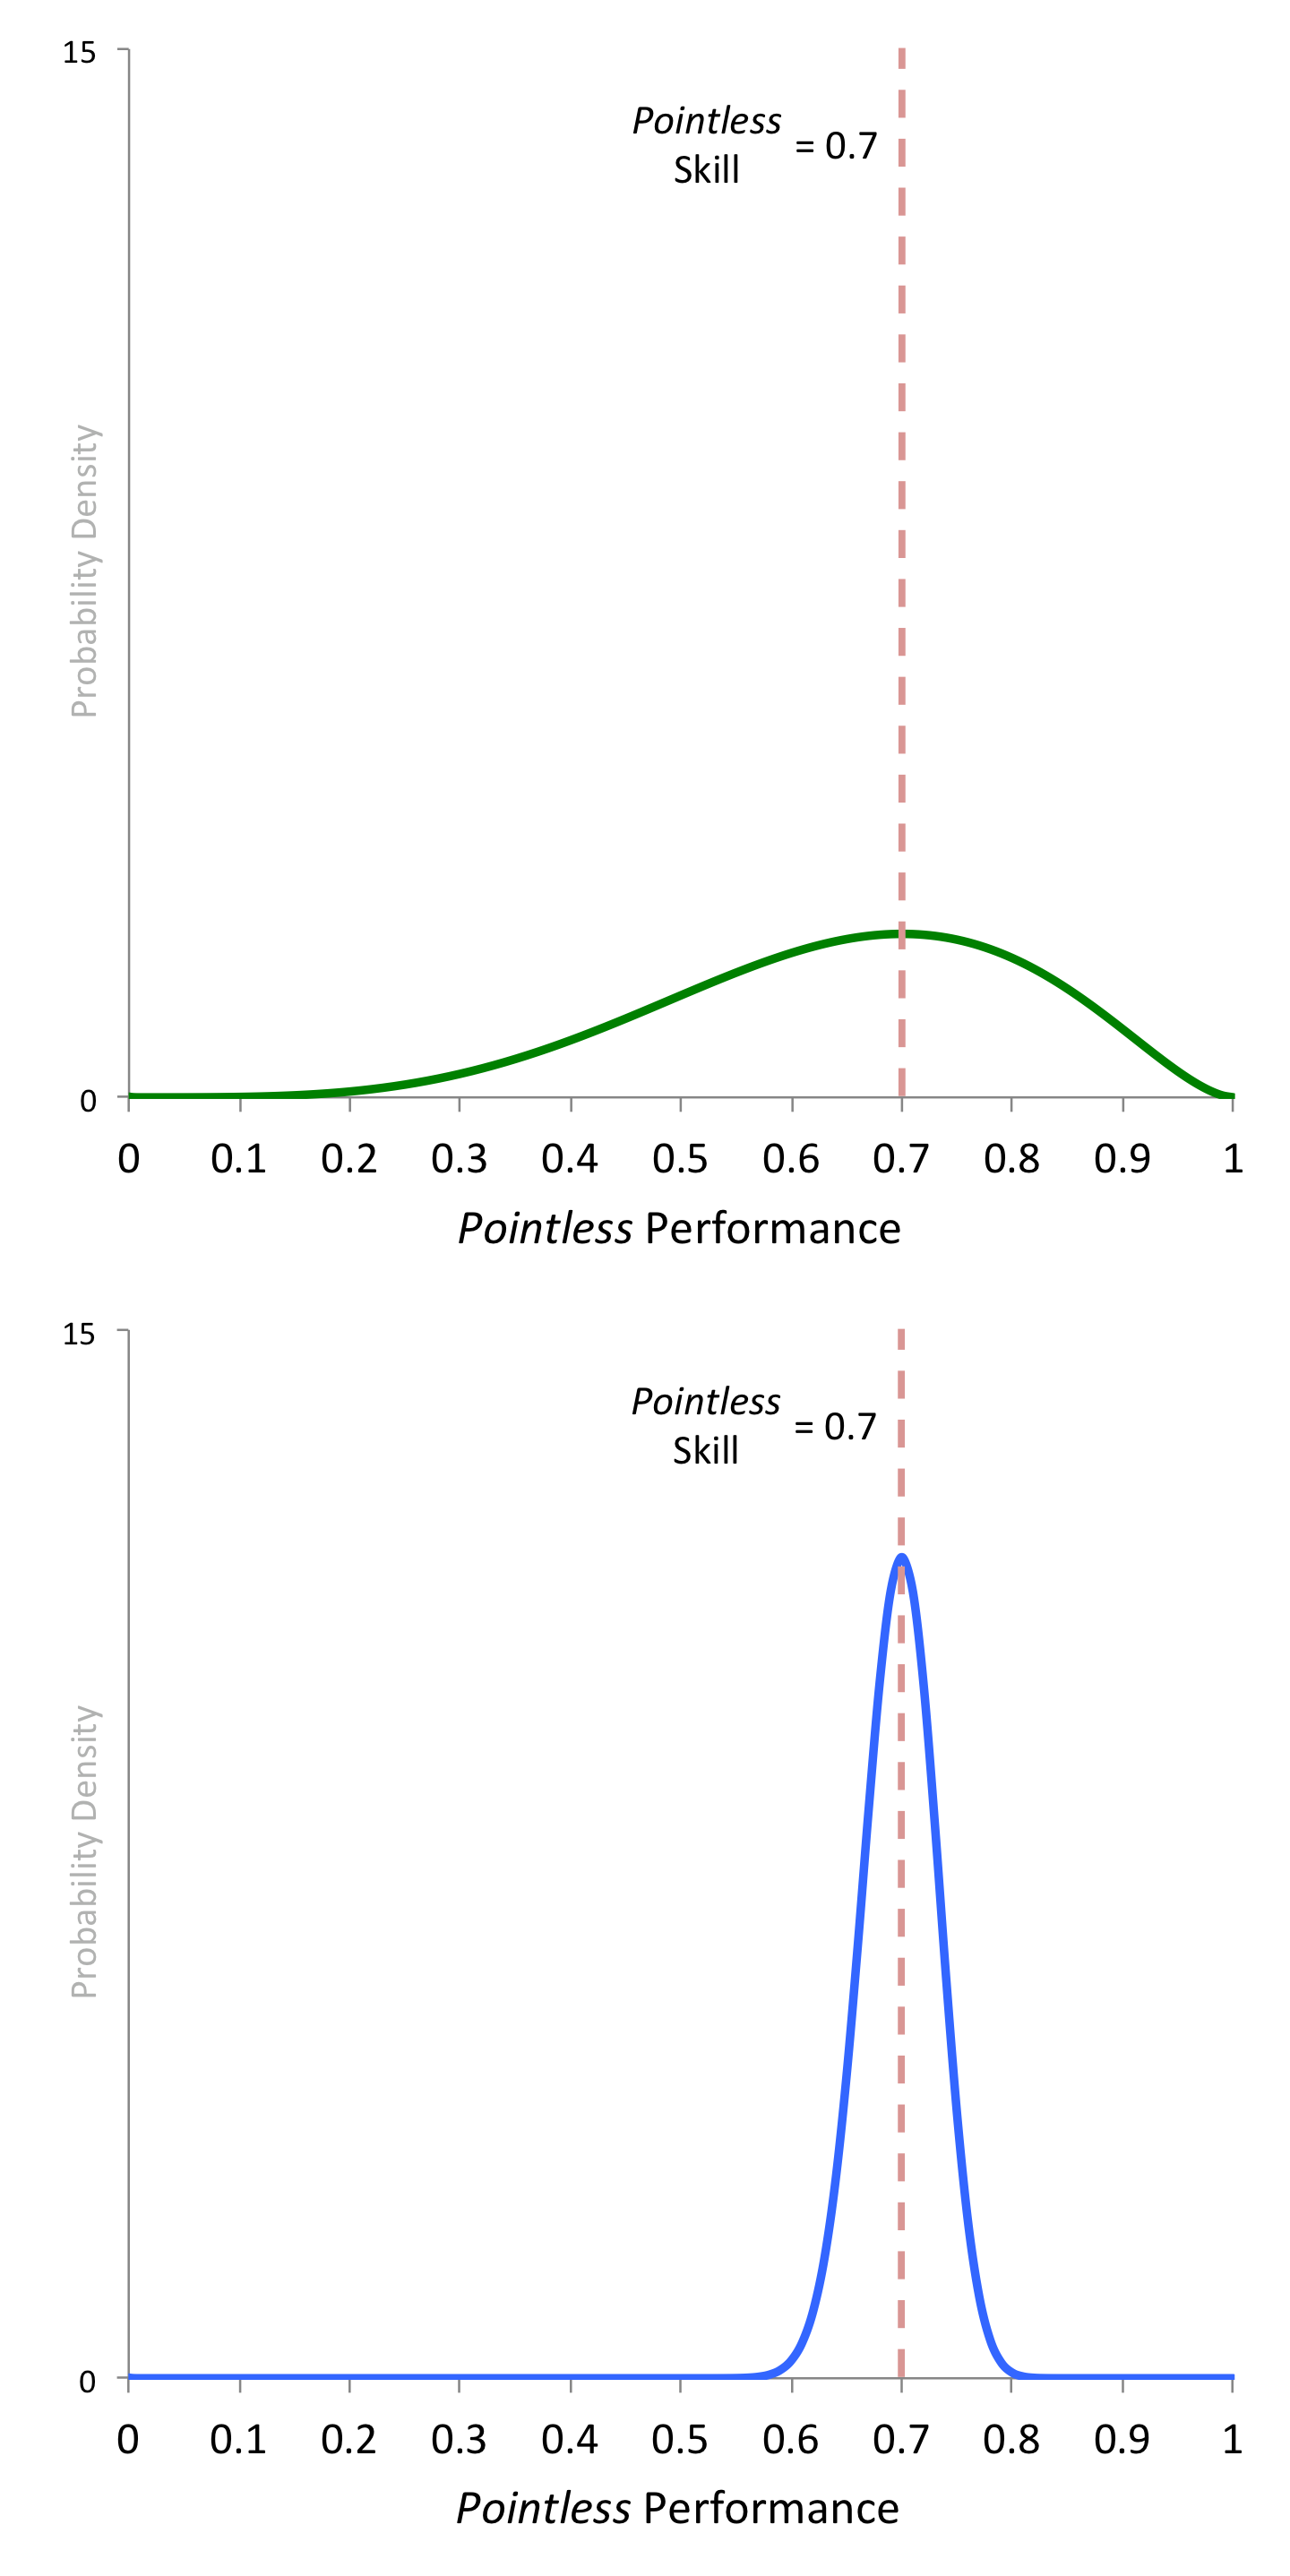
Two Pointless probability distributions
The height of each curve is related to the probability that the team’s Pointless performance will be close to the corresponding value on the horizontal axis.**** In both graphs, we see that the curve is highest at 0.7, the team’s Pointless skill. This means that it is most likely that the performance will be close to this value. However, while the green curve is quite flat and shallow, indicating a wide spread in the possible performance of the team, the blue curve forms a sharp spike, indicating that performance is very unlikely to vary much from 0.7. Therefore, if we think that Pointless mostly about luck, we might use the green probability distribution to generate the performances of the teams, whereas if we think that Pointless is mostly about skill, the blue distribution would be more suitable.
Once we have decided on a probability distribution, we can simulate a new run of Pointless episodes, where results are based partly on luck and partly on skill. For each new team that comes along, we randomly generate their Pointless skill, as before. However, this time, for each episode, we must also use our probability distributions to generate each team’s Pointless performance. The team with the greatest performance wins the episode and so the process continues.
Since I do not know what the balance between luck and skill is in Pointless, I decided to hedge my bets and run ten more simulations (all of one million episodes), changing this balance a little each time and checking the proportions of episodes with each line-up that were produced.***** The results are plotted in the graph below, where we can see how the proportions of episodes with each line-up (represented by the four coloured curves) change as we gradually move from a version of Pointless where results are based on pure luck to a version of Pointless in which results are based on pure skill.******
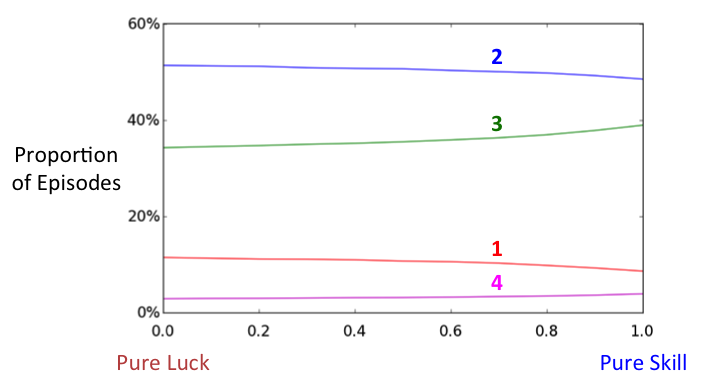
Given some boring caveats that I will not bother going into here, we might expect that the real version of Pointless should be represented by some point on the horizontal axis of this graph, at the value that best represents the particular balance of luck and skill in the genuine version of the programme. The proportions of episodes with each line-up that we would expect to see in reality in the long term, would then be found by cutting the four coloured curves with a vertical line at this value and reading off the four proportions.
Perhaps more interestingly, we could do this procedure in reverse. If we knew the proportions of episodes with each line-up that had occurred in reality, we could match these to the coloured curves and estimate the true balance of luck and skill that Pointless involves. However, since we do not know these proportions, this is all rather academic. All we can really say is that since the curves are really fairly flat, there seems to be little difference between a pure luck Pointless, a pure skill Pointless, or anything in between. We would expect the true proportions of episodes with each line-up to lie somewhere between the pure luck and the pure skill values (in the long term), and since these are quite close together, the values that we calculated in the previous article should not be far wrong after all!
Encouraged by this result, let’s finish by trying to make a new prediction (or postdiction?) about the number of new teams that we think were introduced from series 2 to series 11 of Pointless, as we did in the previous article. However, whereas previously we came up with a single number of new teams (1315), which was unlikely to be precisely correct, this time we will come up with a range of possible values in which the true number should lie, hopefully producing a prediction in which we can have a lot more confidence.

Parallel universes…
In the previous article, we reckoned there were about 575 regular episodes of Pointless broadcast across these ten series (ignoring specials, which do not follow the rules of our sequence). However, this was only an estimate, so let’s say that there were somewhere between 567 and 583 episodes.
Now, by dividing our pure luck and pure skill simulations of one million Pointless episodes into 1715 blocks of 583 episodes, throwing away the excess episodes and throwing away the first block (which may be skewed by our decision to start with four new teams), we can effectively create 2 x 1714 parallel universe versions of Pointless series 2-11, each with 583 episodes. Throwing away the last 16 episodes of each block creates another 2 x 1714 parallel versions of Pointless with our lower limit of 567 episodes.
From these parallel versions of Pointless, we find the following:
- Pure luck, 567 eps:
99% of parallel Pointlesses introduced between 1279 & 1312 new teams; - Pure skill, 567 eps:
99% of parallel Pointlesses introduced between 1336 & 1362 new teams; - Pure luck, 583 eps:
99% of parallel Pointlesses introduced between 1315 & 1349 new teams; - Pure skill, 583 eps:
99% of parallel Pointlesses introduced between 1374 & 1400 new teams.
Taking the minimum and maximum of these values then, we should be able to say with more than 99% certainty that the number of new teams introduced across series 2-11 was somewhere between 1279 and 1400.
And if that is not a pointless answer, then I don’t know what is.
Mathematical notes:
* To be fair, this argument only holds if you compare all returning teams with all new teams. It is probably reasonable to suspect that the average strength of second place teams is greater than the average strength of new teams.
** Calculating from 2009, when the series began.
*** For those who are interested, I have modelled uncertainty in a team’s performance using a beta distribution, with parameters alpha and beta greater than or equal to 1 and with mode fixed to be equal to the team’s skill.
**** Actually, strictly speaking it is the area under the curve that indicates probability. This means that the numbers on the vertical axis can seem a little confusing, since they do not represent probabilities and can be greater than 1.
***** Simulations were performed for 1/alpha = 1, 0.9, 0.8, … , 0.1. When alpha = 1, our probability distributions for performance are actually all uniform distributions, so this scenario corresponds to the pure luck version of Pointless considered in the previous article. Incidentally, the proportions of episode with each line-up observed in this case: 11.5%, 51.4%, 34.3% and 2.9%, were practically identical to the values calculated using Markov analysis.
****** The value on the horizontal axis here is equal to 1-1/alpha. The other distribution parameter, beta, can be calculated from alpha given that the distribution mode is known.
IMAGES:
Usain Bolt: Erik van Leeuwen – Wikimedia Commons
Heads in hands: Finanzer – Wikimedia Commons
Images from Pointless – ukgameshows.com
Others: Original
Thomas Oléron Evans, 2014
Fantastic research!,
I too had thought along similar lines and questioned how many new teams where likely to appear in each episode and put together an excel spreadsheet to model the Markov chain (assuming each team to be of equal strength). After running the simulation 25 times for 1000 consecutive episodes I found on average in every 1000 shows:
119.36 shows had 1 new pair,
508.32 shows had 2 new pairs,
342.06 shows had 3 new pairs and
30.24 shows had 4 new pairs.
Which clearly comes close to the results you found of (11.4%, 51.4%, 34.3% and 2.9%)
I had considered that new teams where perhaps stronger but had not modelled this. I like your work!
I had also considered an imaginary show which had n number of contestants to see how much movement about the mean there was in the Markov chain. When taking n=100 and starting with 100 new contestants on episode 1 the number of new contestants quickly found a mean of 50 with most having between 38 and 62 new contestants.
I’m very glad to know there is someone else out there obsessively analysing the stats of BBC quiz shows, carry on the good work.
Isaac
Glad you liked it.
What I would really like to know is the proportion of each show type in the actual series. That way, you could use my investigation to put some sort of figure on the level of skill involved in playing Pointless. No easy way of getting that info though.
Thanks for reading.
Thomas
Hi there.
I was one of the co-creators of Pointless, but more pertinently, I was the executive producer that first suggested we adopt the “two opportunities to reach the final” rule. The contestant-booking team were not 100% happy.
I don’t know whether it makes things easier or worse that multiple episodes of Pointless are recorded each day, with some contestants being required for one day of filming but others needing to overnight. Working out travel and accommodation arrangements is a bit of a nightmare. Though, like all quiz shows, we always had a stock of local emergency contestants on stand-by for illness/cancellation reasons. I imagine these are also used if the maths goes wrong. (I no longer work on the production.)
I have to admit, I used a million-episode computer simulation to work out how many contestants we’d need per series and per block of filming. I assumed a purely random winning situation, figuring other factors would approximately cancel each other out. I was pleased that reality compared well with my calculations.
I have since gone on to introduce a similar system to the rebooted Fifteen to One. Fifteen contestants per show, each granted up to three appearances in their attempt to reach a show final. The three who do reach a show final then do not return, regardless of how many times they have previously been on the show or whether they won that final or not. Do the Markov chain for that one, I dare you! The contestant team on Fifteen to One hate me even more than those at Pointless!
(P.S. The applied maths is made harder by the desire to feature a good mix of different types of contestant on each show.)
Cheers, Tom
Hi,
Thanks for reading my posts and for your contribution. Very interested to hear that a computer simulation was used to estimate contestant numbers. I must admit, I had assumed that it would have been done more haphazardly than that, so it’s good to know that a more sophisticated method was used.
As for that 15-to-1 Markov chain. I’m on it!
Thanks again,
Thomas